Hi there, and welcome. This content is still relevant, but fairly old. If you are interested in keeping up-to-date with similar articles on profiling, performance testing, and writing performant code, consider signing up to the Four Steps to Faster Software newsletter. Thanks!
In my last post, I demonstrated some techniques for reducing system jitter in low-latency systems. Those techniques brought worst-case inter-thread latency from 11 millliseconds down to 15 microseconds.
I left off having reserved some CPU capacity using the isolcpus boot parameter. While this command stopped any other user-land processes being scheduled on the specified CPUs, there were still some kernel threads restricted to running on those CPUs. These threads can cause unwanted jitter if they are scheduled to execute while your application is running.
To see what other processes are running on the reserved CPUs (in this case 1 & 3), and how long they are running for, perf_events can be used to monitor context switches during a run of the benchmark application:
perf record -e "sched:sched_switch" -C 1,3
A context switch will occur whenever the scheduler decides that another process should be executed on the CPU. This will certainly be a cause of latency, so monitoring this number during a run of the benchmark harness can reveal whether these events are having a negative effect.
Removing swapper (the idle process) and java from the trace output, it is possible to determine how many times these other threads were executed on the supposedly isolated CPUs:
count process
--------------------
1 ksoftirqd/1
4 kworker/1:0
2 kworker/3:1
4 migration/1
4 migration/3
13 watchdog/1
13 watchdog/3
kworker/3:1 656 [003] 9411.223607: workqueue:workqueue_execute_end: work struct 0xffff88021f590520
This command will tell the kernel to only update these values every hour. Note that this may not be a particularly good thing to do - but for the purposes of this investigation it is safe.
Despite significant progress, there is still a large variation in inter-thread latency. At this point, it is clear that our user code is executing all the time (no context switches are now observed); runtime stalls such as safepoints and garbage-collection have been ruled out, and the OS is no longer causing scheduler jitter by switching out application threads in favour of kernel threads.
Clearly something else is still causing the application to take a variable amount to time to pass messages between threads.
Once the software (runtime & OS) is out of the frame, it is time to turn to the hardware. One source of system jitter that originates in the hardware is interrupts. Hardware interrupts sent to the CPU can be viewed in /proc/interrupts:
CPU0 CPU1 CPU2 CPU3
The value can be updated (in most cases) to steer those interrupts away from protected resources:
Once again, a change has been made, and effects should be observed:
That change looks positive, but doesn't remove all the variation. There is still the matter of the other listed interrupts, and these cannot be so easily dealt with. They will be the subject of a later post.
Follow @epickrram
Next steps
I left off having reserved some CPU capacity using the isolcpus boot parameter. While this command stopped any other user-land processes being scheduled on the specified CPUs, there were still some kernel threads restricted to running on those CPUs. These threads can cause unwanted jitter if they are scheduled to execute while your application is running.
To see what other processes are running on the reserved CPUs (in this case 1 & 3), and how long they are running for, perf_events can be used to monitor context switches during a run of the benchmark application:
perf record -e "sched:sched_switch" -C 1,3
A context switch will occur whenever the scheduler decides that another process should be executed on the CPU. This will certainly be a cause of latency, so monitoring this number during a run of the benchmark harness can reveal whether these events are having a negative effect.
Removing swapper (the idle process) and java from the trace output, it is possible to determine how many times these other threads were executed on the supposedly isolated CPUs:
count process
--------------------
1 ksoftirqd/1
4 kworker/1:0
2 kworker/3:1
4 migration/1
4 migration/3
13 watchdog/1
13 watchdog/3
In order to determine whether these processes are contributing significantly to system jitter, the sched_switch event can be studied in more detail to find out how long these processes take to execute.
Cost of context switching
Given a pair of sched_switch events, the delta between the trace timestamps will reveal the interesting piece of data:
java 4154 [003] 5456.403072: sched:sched_switch: java:4154 [120] R ==> watchdog/3:27 [0]
watchdog/3:27 [003] 5456.403074: sched:sched_switch: watchdog/3:27 [0] S ==> java:4154 [120]
In the example above, the runnable java process was switched out in favour of the watchdog process. After 2 microseconds, the now sleeping watchdog is replaced by the java process that was previously running on the CPU.
In this case, the two microsecond context switch doesn't match the worst-case of 15 microseconds, but it is a good indicator that these events could contribute significantly to multi-microsecond levels of jitter within the application.
In this case, the two microsecond context switch doesn't match the worst-case of 15 microseconds, but it is a good indicator that these events could contribute significantly to multi-microsecond levels of jitter within the application.
Armed with this knowledge, it is a simple matter to write a script to report the observed runtimes of each of these kernel threads:
ksoftirqd/1 min: 11us, max: 11us, avg: 11us
kworker/1:0 min: 1us, max: 7us, avg: 5us
kworker/3:1 min: 6us, max: 18us, avg: 12us
watchdog/1 min: 3us, max: 5us, avg: 3us
watchdog/3 min: 2us, max: 5us, avg: 2us
From these results, it can be seen that the kworker threads took up to 18us, soft IRQ processing took 11us, and watchdog up to 5us.
Given the current worst-case latency of ~15us, it appears as though these kernel threads could be responsible for the remaining inter-thread latency.
Dealing with kernel threads
Starting with the process that is taking the most time, the first thing to do is to work out what that process is actually doing.
My favourite way to see what a process is up to is to use another Linux tracing tool, ftrace. The name of this tool is a shortening of 'function tracer', and it's purpose is exactly as described - to trace functions.
Ftrace has many uses and warrants a whole separate post; the interested reader can find more information in the online documentation. For now, I'm concerned with the function_graph plugin, which provides the ability to record any kernel function calls made by a process. Ftrace makes use of the debug filesystem (usually mounted at /sys/kernel/debug/) for control and communication. Luckily, the authors have provided a nice usable front-end in the form of trace-cmd.
Ftrace has many uses and warrants a whole separate post; the interested reader can find more information in the online documentation. For now, I'm concerned with the function_graph plugin, which provides the ability to record any kernel function calls made by a process. Ftrace makes use of the debug filesystem (usually mounted at /sys/kernel/debug/) for control and communication. Luckily, the authors have provided a nice usable front-end in the form of trace-cmd.
To discover why the kworker process is being scheduled, trace-cmd can be used to attach and record function calls:
trace-cmd record -p function_graph -P <PID>
plugin 'function_graph'
plugin 'function_graph'
Hit Ctrl^C to stop recording
...
trace-cmd report
kworker/3:1-656 [003] 8440.438017: funcgraph_entry: | process_one_work() {
...
kworker/3:1-656 [003] 8440.438025: funcgraph_entry: | vmstat_update() {
kworker/3:1-656 [003] 8440.438025: funcgraph_entry: | refresh_cpu_vm_stats() {
The important method here is process_one_work(). It is the function called when there is work to be done in the kernel's per-CPU workqueue. In this particular invocation, the work to be done was a call to the vmstat_update() function.
Since it can be tedious (though enlightening) to walk through the verbose ftrace output, perf_events can be used to get a better view of what workqueue processing is being done via the workqueue trace points compiled into the kernel:
perf record -e "workqueue:*" -C 1,3
Workqueue start/end events can be seen in the trace output:
kworker/3:1 656 [003] 9411.223605: workqueue:workqueue_execute_start: work struct 0xffff88021f590520: function vmstat_update
kworker/3:1 656 [003] 9411.223607: workqueue:workqueue_execute_end: work struct 0xffff88021f590520
A simple script can then be used to determine how long each workqueue item takes:
4000us function vmstat_update ended at 9592.370051
4000us function vmstat_update ended at 9592.370051
4000us function vmstat_update ended at 9593.366948
13000us function vmstat_update ended at 9594.367875
Here the kernel is scheduling calls to update vm per-CPU stats, sometimes taking over 10 microseconds to complete. The function is scheduled to run every second by default.
In order to determine whether this is the source of max inter-thread latency, it is possible to defer this work so that the kworker thread remains dormant. This can be deferred by changing the system setting vm.stat_interval:
In order to determine whether this is the source of max inter-thread latency, it is possible to defer this work so that the kworker thread remains dormant. This can be deferred by changing the system setting vm.stat_interval:
sysctl -w vm.stat_interval=3600
This command will tell the kernel to only update these values every hour. Note that this may not be a particularly good thing to do - but for the purposes of this investigation it is safe.
Validating changes
Since a change has been made, it is good practice to validate that the desired effect has occurred. Re-running the test while monitoring workqueue events should show that there are no more calls to vmstat_update(). Using the method already covered above to observe context switches, it can be seen that other than application threads, only the watchdog processes have executed on the isolated CPUs, proving that kernel worker threads are no longer interfering with the scheduling of the application threads:
count process
-------------------
-------------------
58 watchdog/1
58 watchdog/3
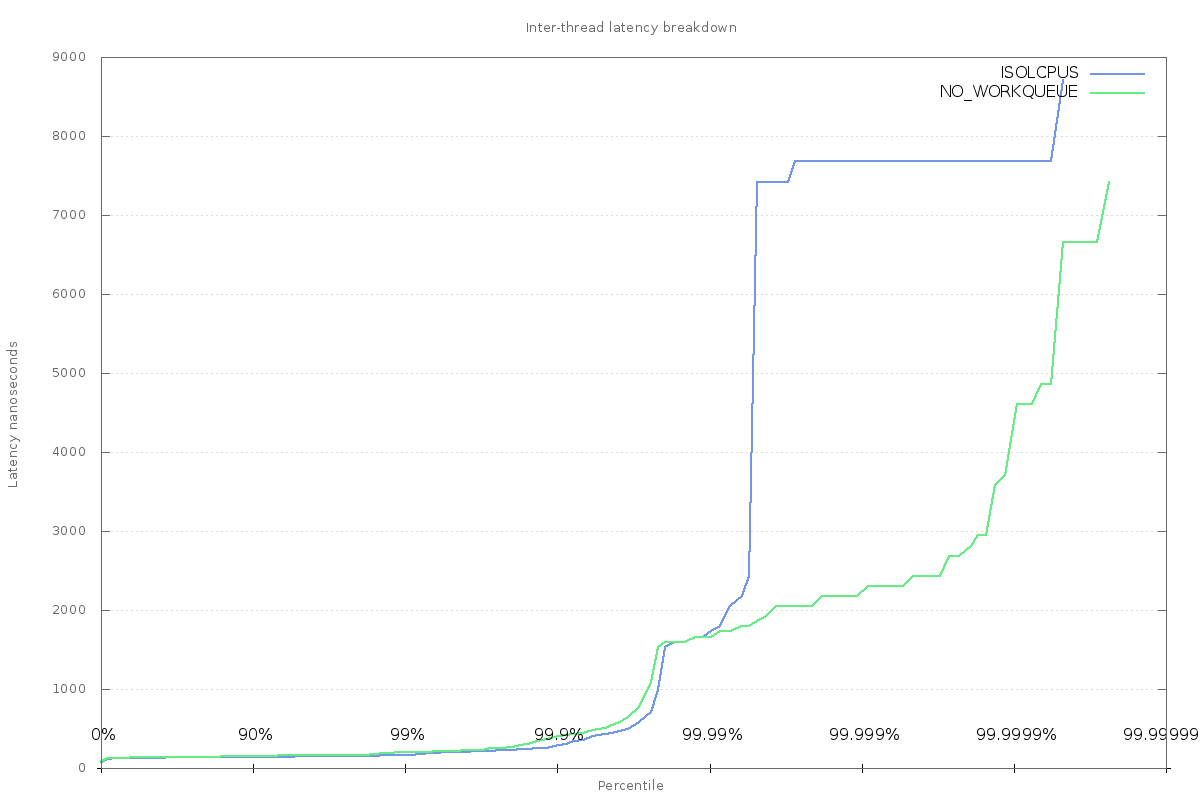
So, has this helped the inter-thread latency? Charting the results against the baseline shows that there is still something else happening to cause jitter, though the worst-case is now down to 7us. There is a clear difference at the higher percentiles - something that used to take 5-7us is gone; this is almost certainly the change to remove calls to vmstat_update(), which aside from doing actual work, also caused a context switch, which comes with its own overhead.
Effect of removing kernel workqueue tasks from isolated cpus
Next on the list are the watchdog threads. These are processes created by the kernel to monitor the operating system, making sure that there aren't any runaway software processes causing system instability. It is possible to disable these with the boot parameter nosoftlockup. An exhaustive list of kernel boot parameters can be found here. The effect of disabling these processes means that the system is no longer able to detect CPU-hogging processes, so should be done with caution.
After rebooting and confirming that the watchdog processes are no longer created, the test must be executed again to observe whether this change has had any effect.
After rebooting and confirming that the watchdog processes are no longer created, the test must be executed again to observe whether this change has had any effect.
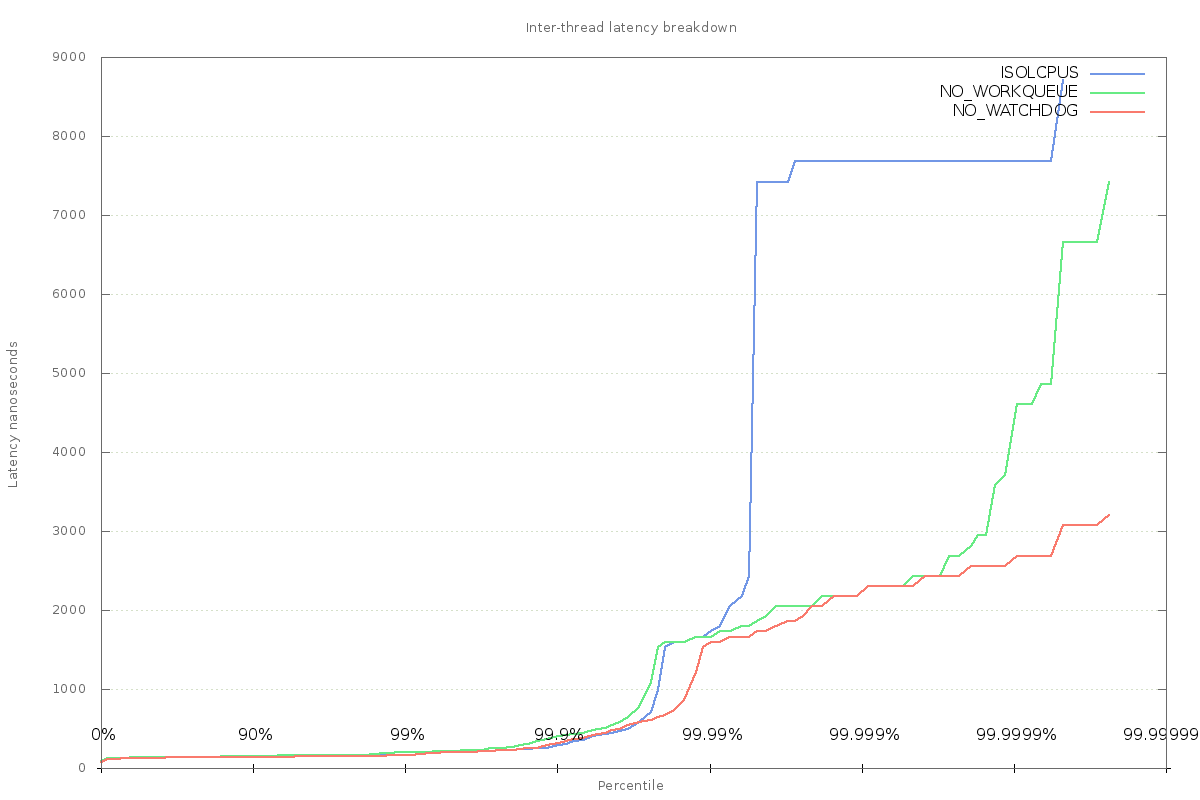
After removing the watchdog processes and re-running the test, the worst-case latency is down to 3us - a clear win. Since the watchdog's workload is actually very small, it's reasonable to put most of the saving down to the fact that the application threads are no longer context-switched out.
Deeper down the stack
Despite significant progress, there is still a large variation in inter-thread latency. At this point, it is clear that our user code is executing all the time (no context switches are now observed); runtime stalls such as safepoints and garbage-collection have been ruled out, and the OS is no longer causing scheduler jitter by switching out application threads in favour of kernel threads.
Clearly something else is still causing the application to take a variable amount to time to pass messages between threads.
Once the software (runtime & OS) is out of the frame, it is time to turn to the hardware. One source of system jitter that originates in the hardware is interrupts. Hardware interrupts sent to the CPU can be viewed in /proc/interrupts:
cat /proc/interrupts
CPU0 CPU1 CPU2 CPU3
0: 43 0 0 0 IR-IO-APIC-edge timer
1: 342 96 3598 16 IR-IO-APIC-edge i8042
3: 3 0 0 0 IR-IO-APIC-fasteoi AudioDSP, dw_dmac
6: 0 0 0 0 IR-IO-APIC-fasteoi dw_dmac
7: 930 5 198 134 IR-IO-APIC-fasteoi INT3432:00, INT3433:00
8: 0 0 1 0 IR-IO-APIC-edge rtc0
CPU0 CPU1 CPU2 CPU3
0: 43 0 0 0 IR-IO-APIC-edge timer
1: 342 96 3598 16 IR-IO-APIC-edge i8042
3: 3 0 0 0 IR-IO-APIC-fasteoi AudioDSP, dw_dmac
6: 0 0 0 0 IR-IO-APIC-fasteoi dw_dmac
7: 930 5 198 134 IR-IO-APIC-fasteoi INT3432:00, INT3433:00
8: 0 0 1 0 IR-IO-APIC-edge rtc0
This file can be used to check whether any hardware interrupts were sent to the isolated CPUs during the course of a test run. Note that perf_events can also be used via the irq trace points.
Comparing snapshots of the file show that the following interrupts occurred during the run:
CPU0 CPU1 CPU2 CPU3
47: 66878 1362->1366 29700 1951->1952 IR-PCI-MSI-edge i915
LOC: 123968 449426->489201 627266 469447->509306 Local timer interrupts
RES: 35257 227->247 42175 241->261 Rescheduling interrupts
TLB: 4198 59 4388 76->92 TLB shootdowns
Here I'm highlighting interrupt counts that changed during the execution of the benchmark, and that may have contributed to inter-thread latency.
Each interrupt has an associated name that, in some cases, can be used to determine what it is used for.
On my laptop, IRQ 47 is associated with the i915 intel graphics driver, and some hardware events have been raised on the isolated CPUs. This will have an impact on the executing processes, so these interrupts should be removed if possible. Bear in mind that some systems have a dynamic affinity allocator in the form of irqbalance; if you want to manually set interrupt affinity, make sure that nothing is going to interfere with your settings.
Most of the numbered IRQs can be shifted onto another CPU by interacting with the proc filesystem. To find out where the device can currently send interrupts, inspect the current value of smp_affinity_list, which is a list of allowed CPUs for handling this interrupt:
cat /proc/irq/47/smp_affinity_list
0-3
The value can be updated (in most cases) to steer those interrupts away from protected resources:
echo 0,2 > /proc/irq/47/smp_affinity_list
cat /proc/irq/47/smp_affinity_list
0,2
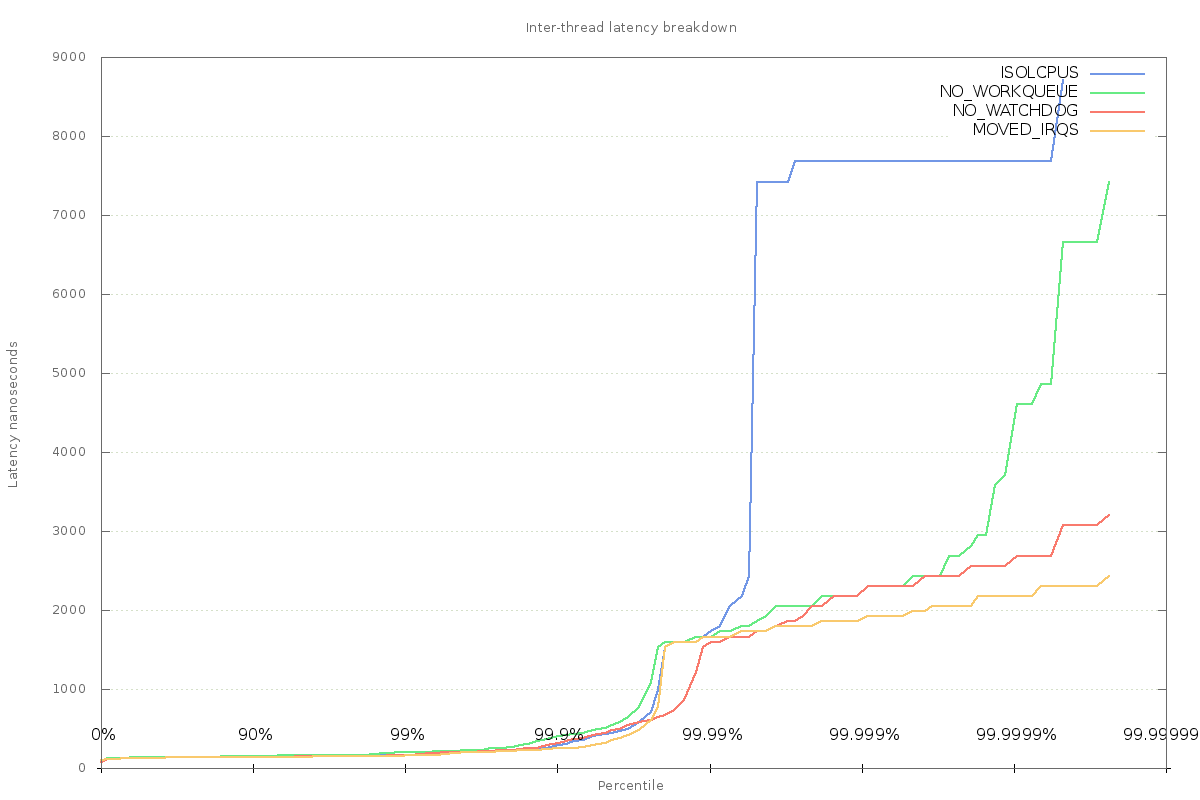
Once again, a change has been made, and effects should be observed:
That change looks positive, but doesn't remove all the variation. There is still the matter of the other listed interrupts, and these cannot be so easily dealt with. They will be the subject of a later post.
Conclusion
Protecting CPU resource from unwanted scheduler pressure is vital when tuning for low-latency. There are several mechanisms available for reducing scheduler jitter, with a minimum being to remove the required CPUs from the default scheduling domain.
Further steps must be taken to reduce work done on the kernel's behalf, as this workload is able to pre-empt your application at any time. Kernel processes run at a higher priority than user-land processes managed by the default scheduler, so will always win.
Even ruling out software interaction is not enough to fully remove adverse effects from running code - hardware interrupts will cause your program's execution to stop while the interrupt is being serviced.
There is information available in the kernel via the proc file-system, or from tracing tools, that will shine a light on what is happening deeper in the guts of the kernel.
Further tuning using the methods described above has reduced inter-thread latency jitter from 15 microseconds to 2.5 microseconds. Still a long way off the mean value of a few hundred nanoseconds, but definitely getting closer.
Follow @epickrram


